Financial Projections
Assumptions
About the cost of the foods:
| Content | Estimated Costs |
|---|---|
| Meal | $8.00 to $15.00 |
| Lunch | $8.79 |
| Dinner | $13.74 |
Assumptions about the restaurants:
| Restaurants | Estimation |
|---|---|
| Location | Downtown Ghetto |
| Size | $5000 square feet |
| Tables | 20 |
| Seats | 86 |
| Parking space | 40 |
| Employee | 18 |
$860,000 - $1,200,000 revenue target; Industry average for casual restaurant average of $860,000.
Annual 3% increase for inflation and 5% annual increase in revenues
- Year 2 Assumes Catering Business in Place.
- Assumes 4 parties monthly at $15 per plate and $50 persons.
- Catering will escalate to 8 parties monthly in month 20 and then 10 parties monthly thereafter.
- Assumes additional increase in staffing (4 persons to be hired at 6 hours at $8.00 per hour).
Start-Up Costs
Total start up costs will be $363,000, $174,000 of which will be contributed by the owners and the remainder will be secured through a proposed bank loan.
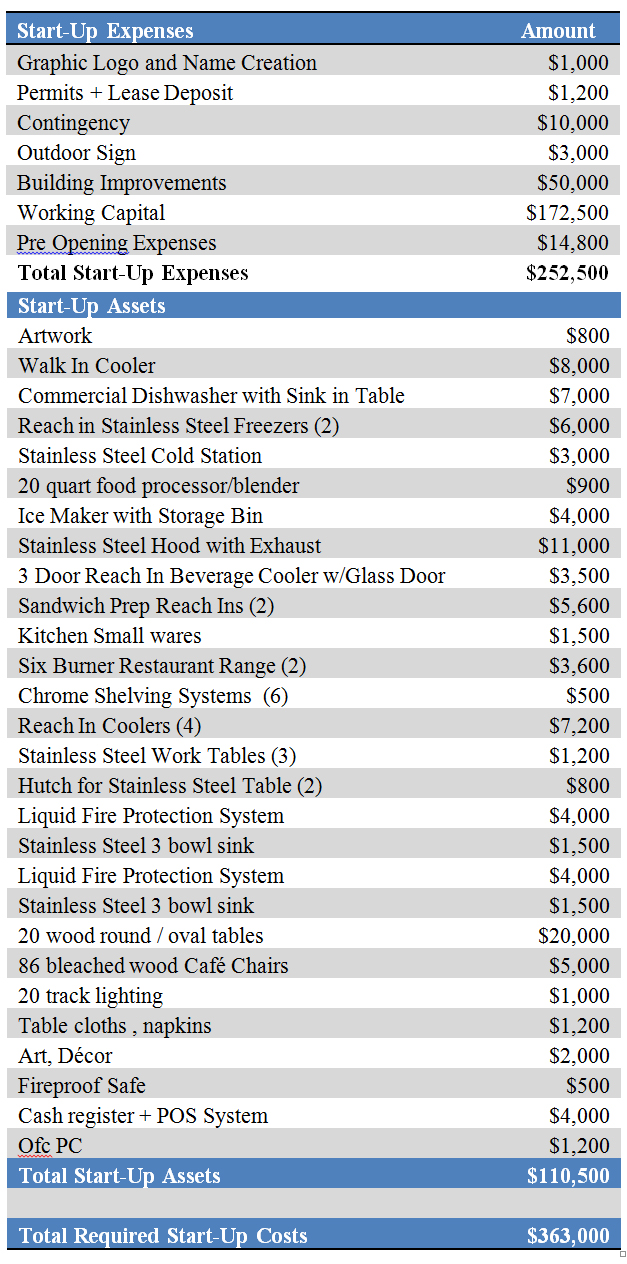
Startup costs and expense projection
Source and Use of Funds
Total start-up costs are estimated to be $363,000. The majority of the costs are associated with the restaurant equipment, inventory and furniture and furnishings for the dining room. Total costs for these items are reported to be $110,500. The costs are associated with build out and renovation of the restaurant to provide updated plumbing and creating additional space in the dining area by removing a non-supporting wall: $50,000. Additional start up expenses are in the form of working capital and contingency $182,500.
Jeff and Betty Wright will contribute $174, 000 and are requesting an additional $189,000 in the form of a bank loan. The loan is expected to be a fully amortizing 5 year term note secured by UCC filings on all furniture fixtures and equipment.
Estimated source and use of funds
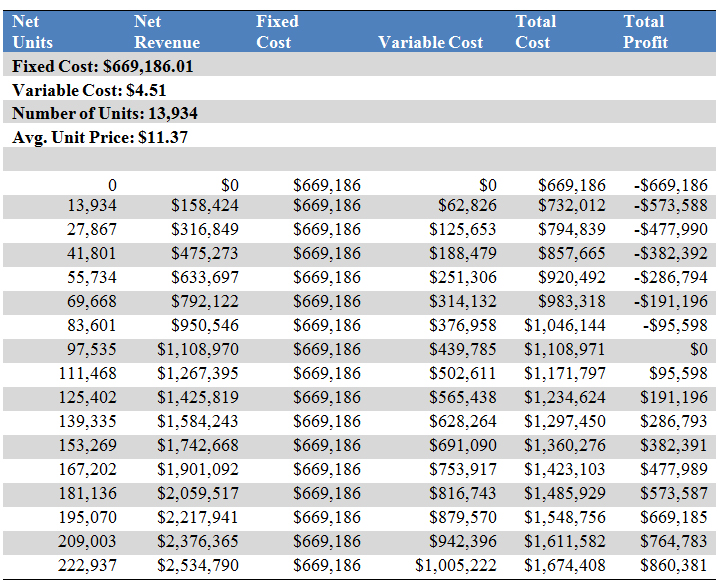
Break-Even Analysis
Total fixed costs associated with the restaurant are $669,186 and represent the annual expenses. The variable cost (overhead) is estimated to be $4.51 per meal. Based on the assumption of $11.37 as the average meal price, the breakeven revenue then is $1,108,970 or 97,535 meals (units). This is further depicted in the Table Below and the Graph that follow:
Projected break-even analysis
Financial Projections
Projected Profit and Loss
The profit and loss demonstrates modest increases in revenues over the three expected years with adjustments for inflation.
Projected profit and loss
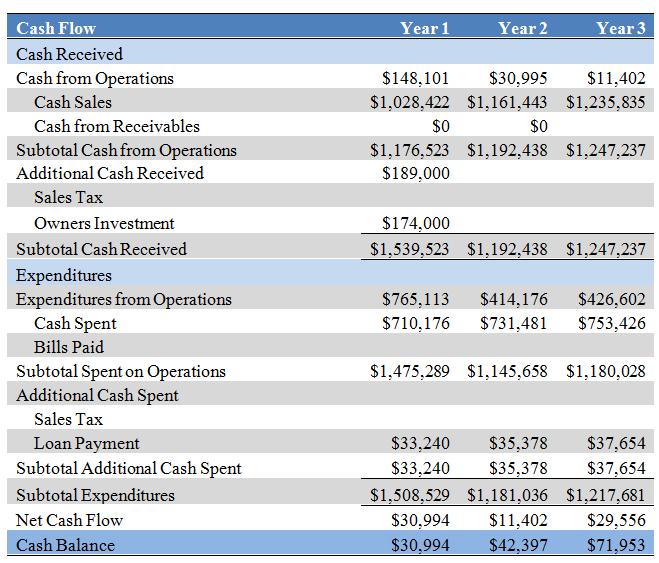
Projected Cash Flow
Projected cash flow
Projected Balance Sheet
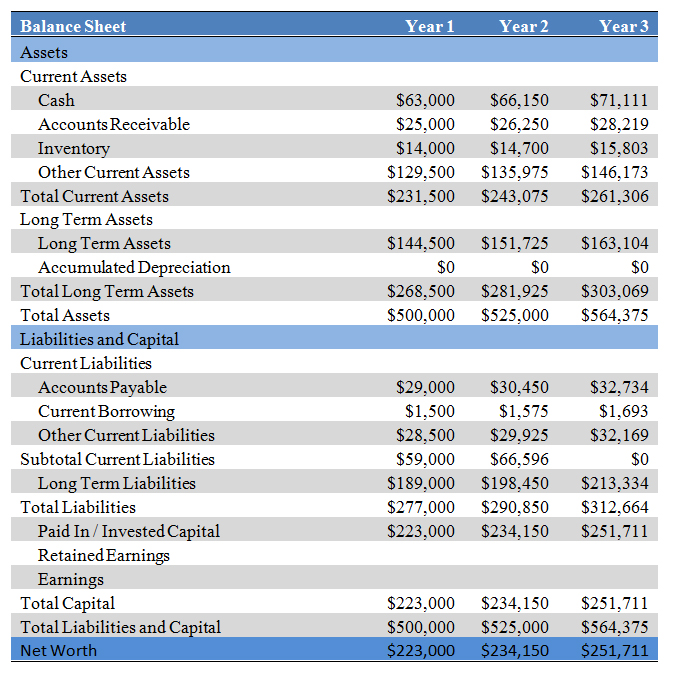
Projected balance sheet
Business Ratios
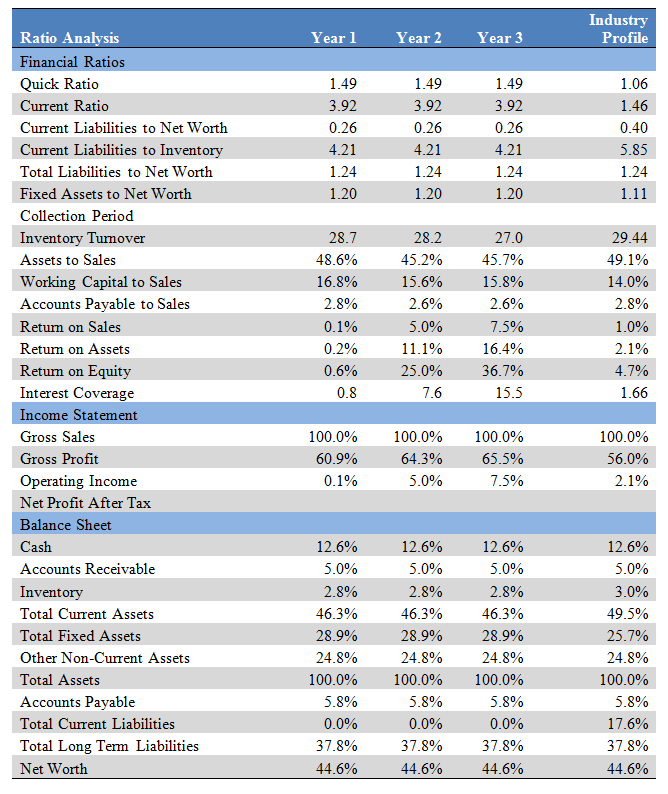
Ratio analysis
Hourly Labor Schedule
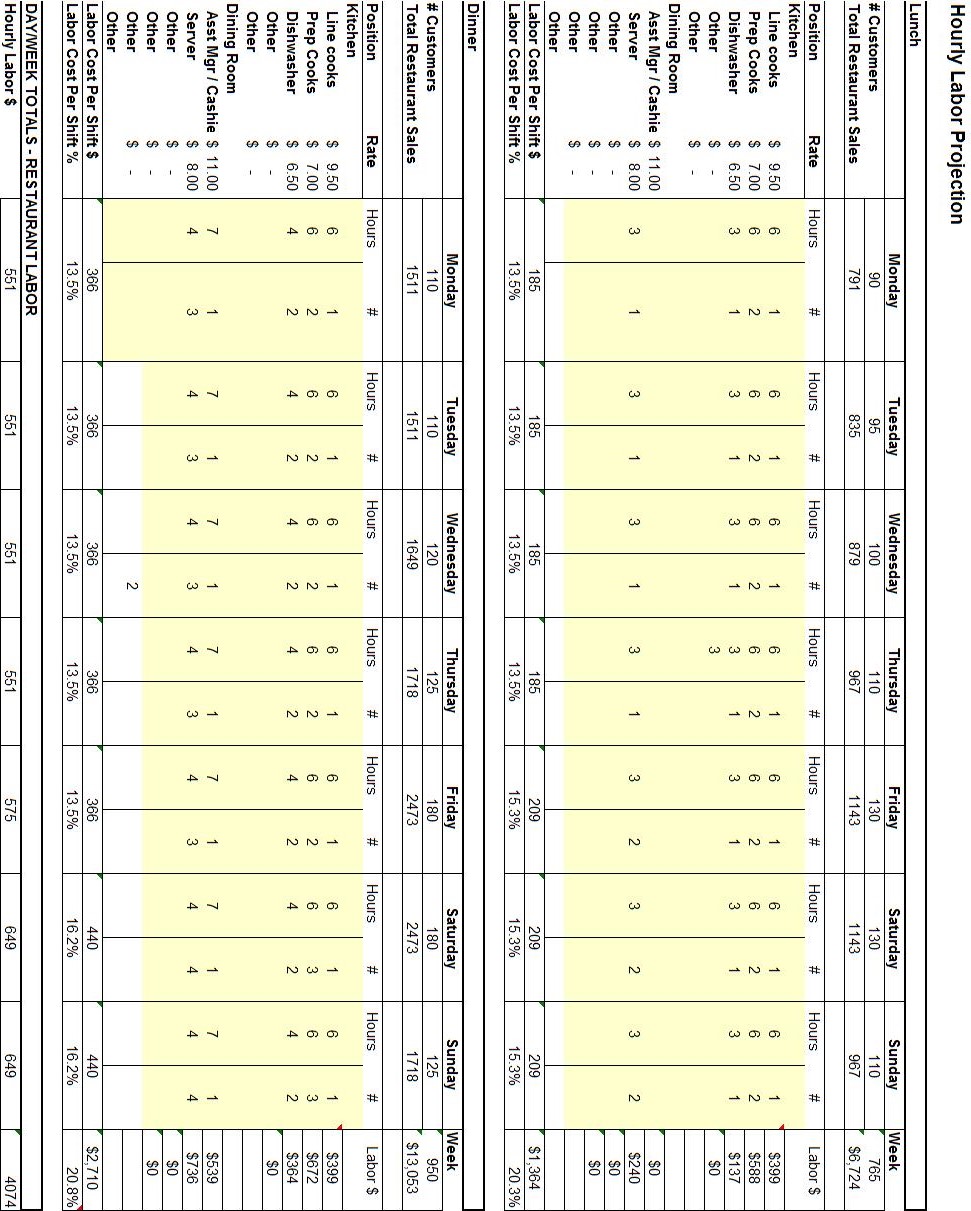
Hourly labout projection
Weekly Sales Projections

Weekly sales projection